| Region ID | Region Name | Crop Moisture Index | Palmer Drought Severity Index | Standardized Precipitation Index | Keetch-Byram Drought Index | Reservoir Storage Index | Streamflow Index |
|---|---|---|---|---|---|---|---|
| Context | Short-term meteorologic | General, hydrologic | Precipitation | Fire risk | Water supply | Streamflow | |
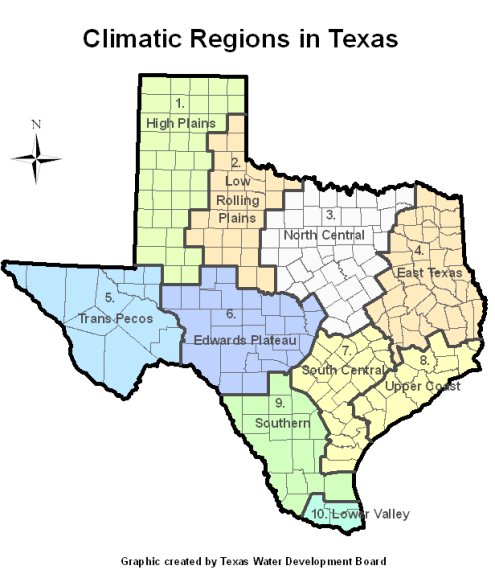
| 1 | High Plains | Abnormally Dry | Extreme Drought | Near Normal | High Risk | Exceptionally Low | Moderately Low |
| 2 | Low Rolling Plains | Abnormally Dry | Severe Drought | Moderately Dry | High Risk | Severely Low | Extremely Low |
| 3 | North Central | Slightly Dry or Favorably Moist | Moderate Drought | Near Normal | Above Average | Near Normal | Abnormally Dry |
| 4 | East Texas | Slightly Dry or Favorably Moist | Moderate Drought | Moderately Dry | Above Average | Near Normal | Near Normal |
| 5 | Trans Pecos | Abnormally Dry | Severe Drought | Near Normal | Very High Risk | Extremely Low | Exceptionally Low |
| 6 | Edwards Plateau | Abnormally Dry | Moderate Drought | Moderately Dry | Above Average | Severely Low | Near Normal |
| 7 | South Central | Abnormally Dry | Severe Drought | Near Normal | Above Average | Moderately Low | Abnormally Dry |
| 8 | Upper Coast | Slightly Dry or Favorably Moist | Moderate Drought | Near Normal | High Risk | Near Normal | Severely Low |
| 9 | Southern | Excessively Dry | Severe Drought | Near Normal | Average or Low | Severely Low | Abnormally Dry |
| 10 | Lower Valley | Excessively Dry | Moderate Drought | Near Normal | High Risk | No Data | No Data |
Drought Severity by Climatic Region on 6/14/2013